Get Plates
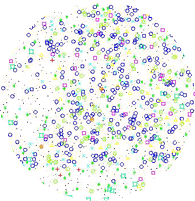
Each spectroscopic plate has multiple spectra observed simultaneously (e.g., 640 for SDSS, 1000 for BOSS/eBOSS or 300 for APOGEE). The plate itself is made of aluminum, with a tiny hole at the position of each object to be observed. We plug an optical fiber into each hole. The other end of the fibers leads the light into the spectrograph. The figure below shows where each fiber has plugged in to the plate. The table below gives a list of all the objects in the plate by fiber number, type, and redshift. Clicking on any entry will bring up a picture of the corresponding object's spectrum.
This page gives you easy access to GIF images of individual spectra on a given
plate. Select a plate on the form below, then click on an entry to see the object's
spectrum. For each spectrum, there is also a
 link
to its corresponding object in the image catalog (PhotoObj) that takes you to the
Explorer page (see Visual Tools) for that object. If you want to use these images on
your website, please feel free to do so, but give us an acknowledgement.
